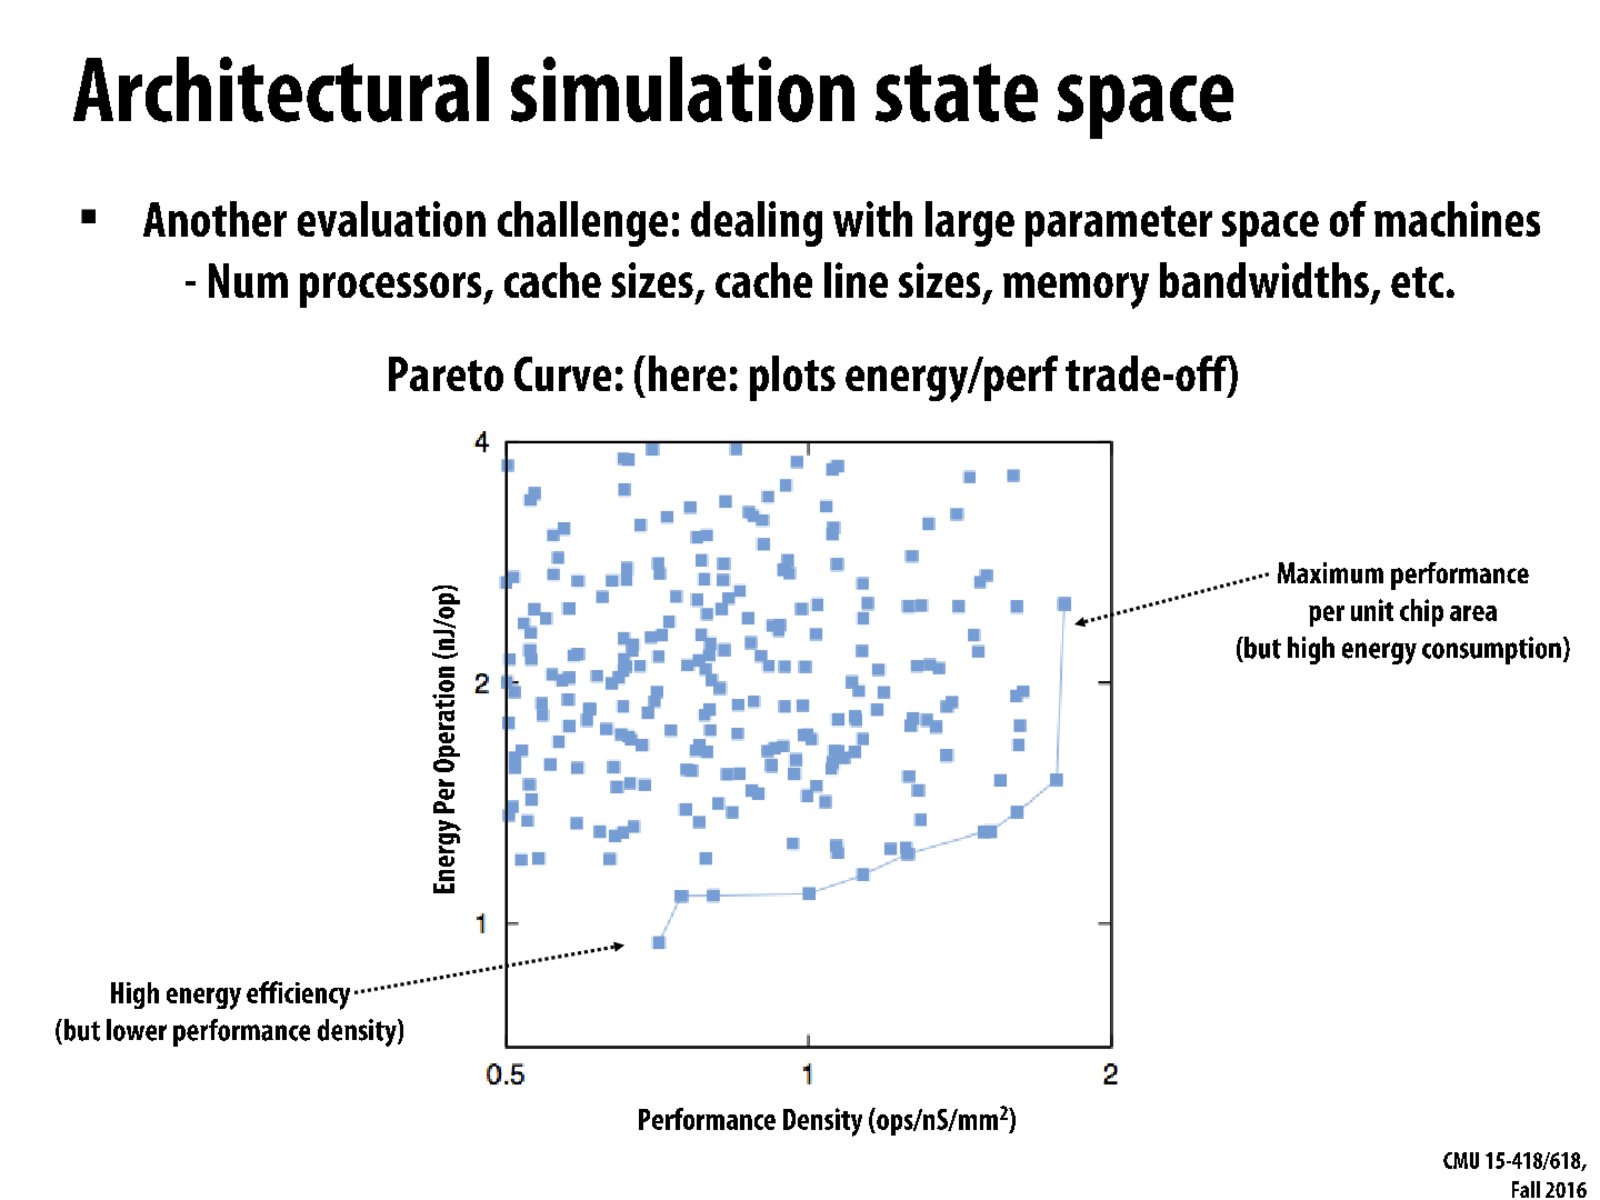
How are there multiple "Energy per Operation" points for almost the same "Performance Density"? Or maybe I'm not understanding the chart correctly?
bpr
@kevinle1, this chart is the combined measurements of ~50 different designs, where some of the data points may be older designs. Sometimes adding a feature to a design might have significant energy cost but only provide negligible performance gains. So you are reading the chart correctly.
How are there multiple "Energy per Operation" points for almost the same "Performance Density"? Or maybe I'm not understanding the chart correctly?
@kevinle1, this chart is the combined measurements of ~50 different designs, where some of the data points may be older designs. Sometimes adding a feature to a design might have significant energy cost but only provide negligible performance gains. So you are reading the chart correctly.