Here the speedup seems better because we make use of sqrt(r) + n - r cores in average for the parallel part instead of n/sqrt(r) cores.
This comment was marked helpful 0 times.
kayvonf
@xiaoend: I think you may have misinterpretted the graphs. Let me try:
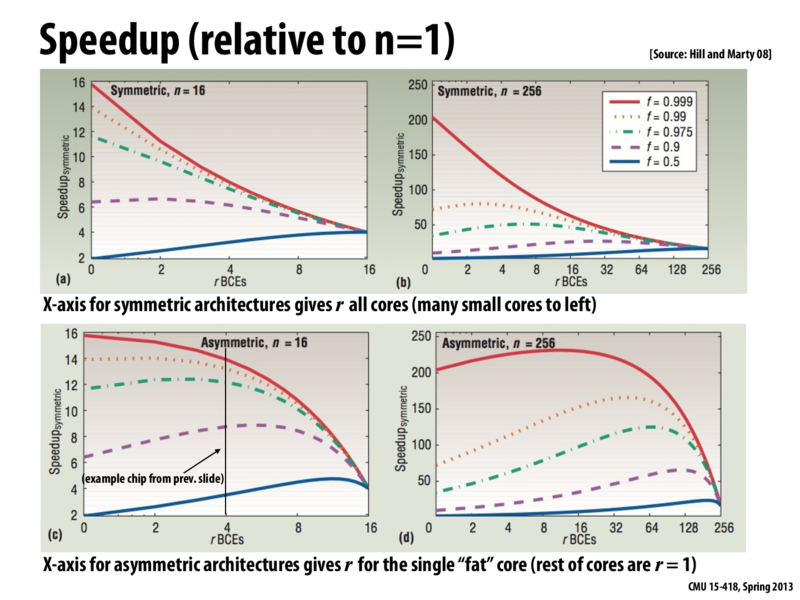
Assume there are a fixed amount of resources (think: transistors) an architect can use to build a chip (this is given by the variable N). In the left column: N=16. In the right column, N=256 (a bigger chip).
The top row of graphs shows how performance for different workloads (one workload per curve) varies when the N resources are used to make N/r homogeneous cores of 'r' resources each. These cores have sequential performance $sqrt(r)$ In the graphs, the X-axis is r. Notice how the parallel workload runs fastest when the chip consists of many cores (and thus provided maximum throughput). The workloads with more sequential components run better when the chip uses larger cores to provided higher sequential performance.
The bottom row of graphs show how performance for different workloads changes if the N resources are partitioned into one "fat" core containing r resources (performance $sqrt(r)$) and N-r "tiny" cores of performance 1.
In the N=16 case, the heterogeneous solution that uses a single fat core of size r=4to r=8, is able to provide highest overall performance across the workloads. In the N=256 case, we seem to be best off build a fat core where r=64 to r=128.
This comment was marked helpful 0 times.
xiaowend
@kayvonf: You are right.
I intended to say why the bottom row of graphs have better speedup with various number of cores than top ones.
And one advantage of asymmetric architectures is that they can guarantee the average performance is (sqrt(r)+n-r) which is better than n/sqrt(r) for symmetric architectures.
And the performances of sequential part remain same.
"One big core" can do sequential part quickly while the small cores can do parallel part faster.
Here the speedup seems better because we make use of sqrt(r) + n - r cores in average for the parallel part instead of n/sqrt(r) cores.
This comment was marked helpful 0 times.
@xiaoend: I think you may have misinterpretted the graphs. Let me try:
Assume there are a fixed amount of resources (think: transistors) an architect can use to build a chip (this is given by the variable
N). In the left column:N=16. In the right column,N=256 (a bigger chip).The top row of graphs shows how performance for different workloads (one workload per curve) varies when the
Nresources are used to makeN/rhomogeneous cores of 'r' resources each. These cores have sequential performance $sqrt(r)$ In the graphs, the X-axis isr. Notice how the parallel workload runs fastest when the chip consists of many cores (and thus provided maximum throughput). The workloads with more sequential components run better when the chip uses larger cores to provided higher sequential performance.The bottom row of graphs show how performance for different workloads changes if the
Nresources are partitioned into one "fat" core containingrresources (performance $sqrt(r)$) and N-r "tiny" cores of performance 1.In the N=16 case, the heterogeneous solution that uses a single fat core of size r=4to r=8, is able to provide highest overall performance across the workloads. In the N=256 case, we seem to be best off build a fat core where r=64 to r=128.
This comment was marked helpful 0 times.
@kayvonf: You are right.
I intended to say why the bottom row of graphs have better speedup with various number of cores than top ones.
And one advantage of asymmetric architectures is that they can guarantee the average performance is (sqrt(r)+n-r) which is better than n/sqrt(r) for symmetric architectures.
And the performances of sequential part remain same.
"One big core" can do sequential part quickly while the small cores can do parallel part faster.
This comment was marked helpful 1 times.