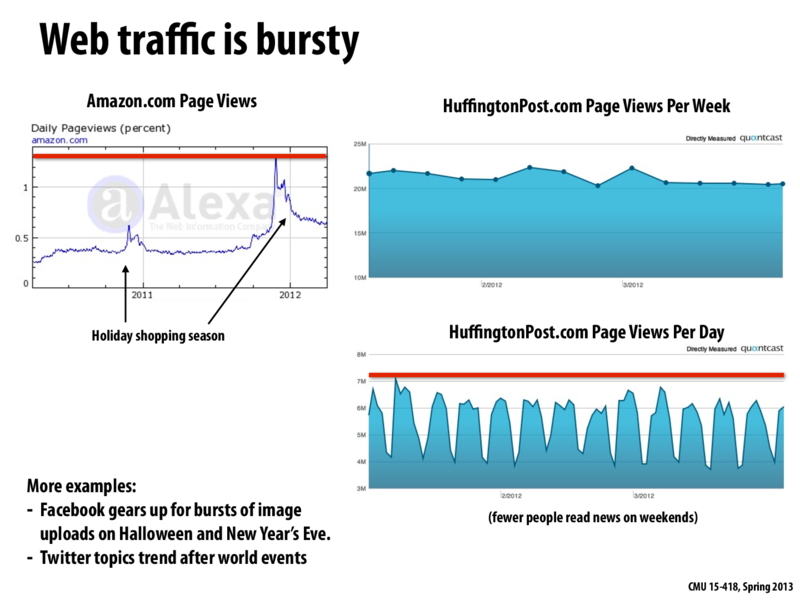
This shows that we have fluctuating demand for servers. As in Amazon or HuffingtonPost, the demand for servers can be regular, but some other sites can have irregular burst of demand for server capability. This suggests the need for efficient elastic web servers which can handle not only regular demands but also sudden and unexpected burst as well.
This comment was marked helpful 0 times.
dyc
Could someone explain the Y axis of the Amazon.com graph? I understand the trend that the graph is trying to convey, but what does Daily Pageviews (percent) measure? Just curious at this point..
This comment was marked helpful 0 times.
nkindberg
@dyc I believe it's the percentage of global page views across the entire web according to alexa.com
This shows that we have fluctuating demand for servers. As in Amazon or HuffingtonPost, the demand for servers can be regular, but some other sites can have irregular burst of demand for server capability. This suggests the need for efficient elastic web servers which can handle not only regular demands but also sudden and unexpected burst as well.
This comment was marked helpful 0 times.
Could someone explain the Y axis of the Amazon.com graph? I understand the trend that the graph is trying to convey, but what does Daily Pageviews (percent) measure? Just curious at this point..
This comment was marked helpful 0 times.
@dyc I believe it's the percentage of global page views across the entire web according to alexa.com
This comment was marked helpful 0 times.