I wonder if anyone has ever used these performance counters to dynamically change program behavior. Rather than coding with a single, particular architecture in mind, one could use a quick diagnostic to decide how to divvy up work optimally.
Of course, it's probably more reasonable to just ask the computer to report it's cache setup directly, but this would at least be a very general and uniform way to get that sort of information.
bpr
Yes. I know that dynamic compilation may use different counters and strategies to decide which code should be optimized and how. Similar to your suggestion, in Brainy (http://dl.acm.org/citation.cfm?id=1993509), we used performance counters and other metrics to configure the application's data structures to the particular hardware.
althalus
Apple's Time Profiler is a really easy way to figure out exactly how much time each function in your program takes if you just want timing information instead of figuring out memory accesses.
haboric
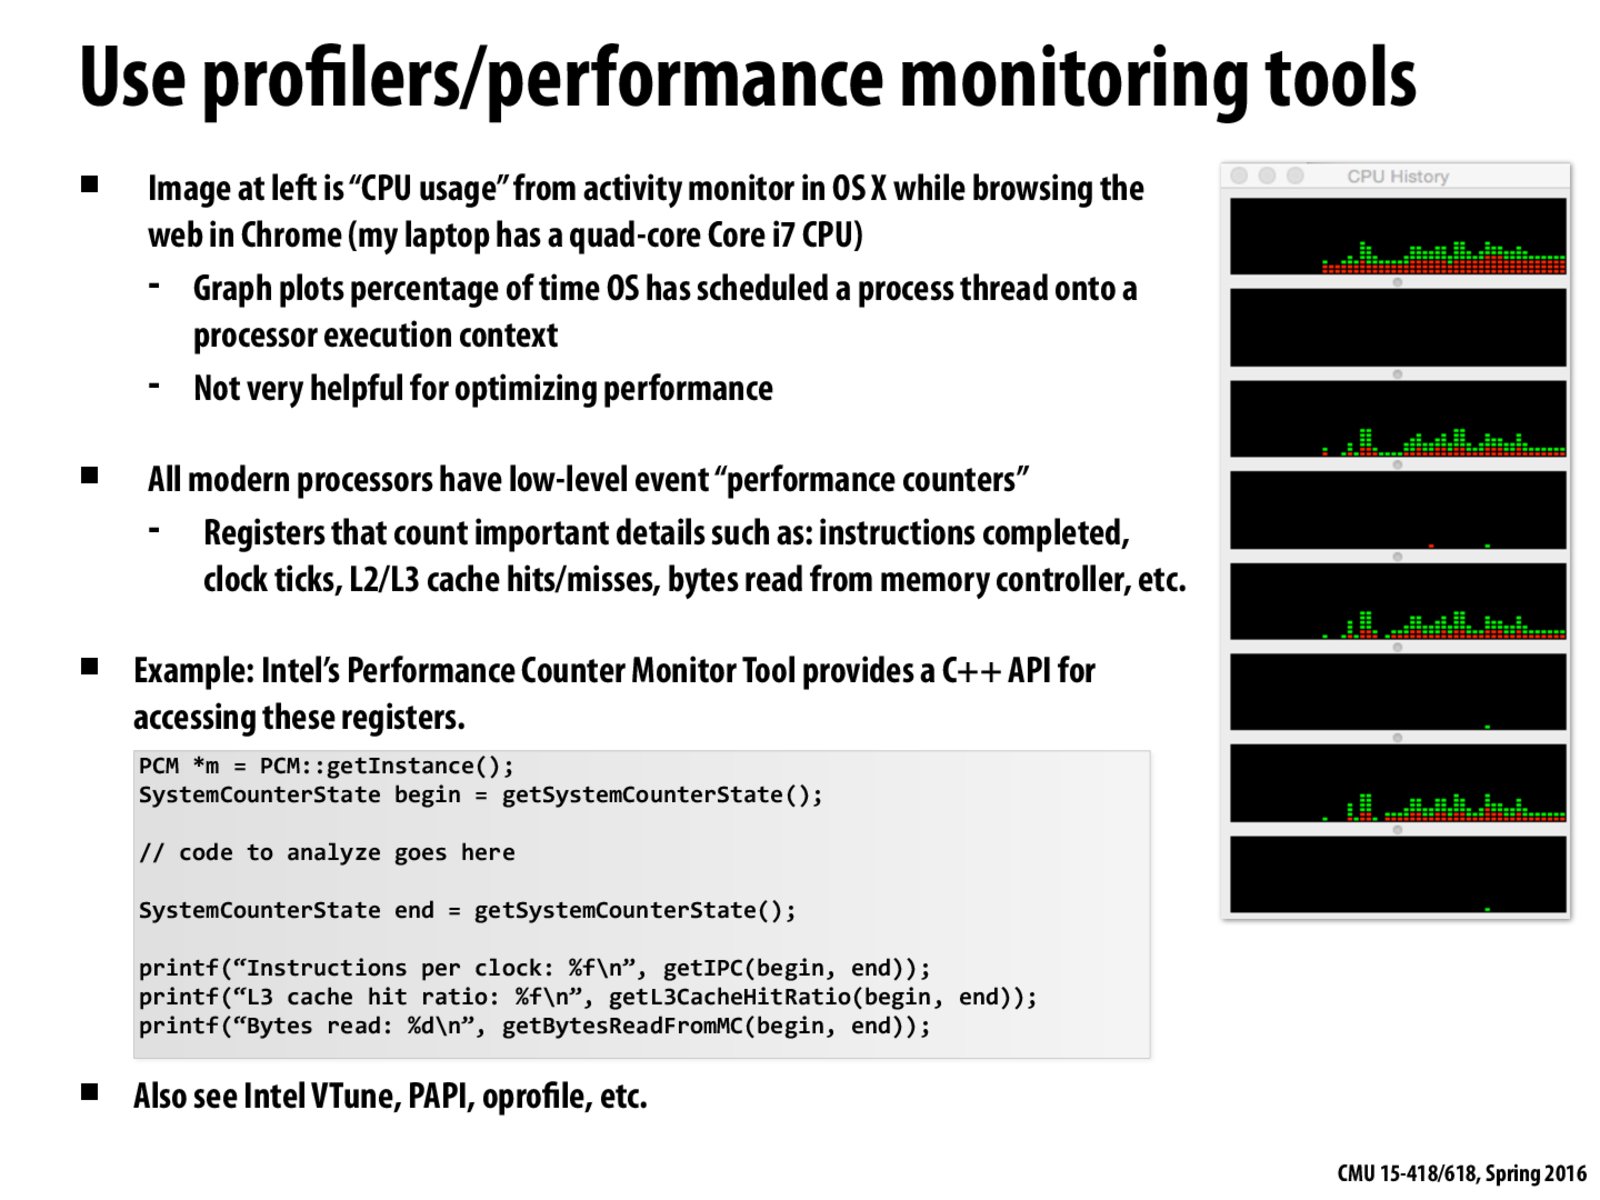
As Prof. Kayvon explained in class, red parts in the graph correspond to the time spent in kernel.
ojd
@PID_1: This is actually where the current state of the art is with scheduling algorithms. It's not hard to implement something like that and see an improvement in general, but it's brutally difficult to do the analysis and there are many industries that won't go anywhere near an algorithm that doesn't have hard guarantees about when things will happen. Quite a few people here at CMU, such as Umut Acar, have done work in this area, if you're interested.
I wonder if anyone has ever used these performance counters to dynamically change program behavior. Rather than coding with a single, particular architecture in mind, one could use a quick diagnostic to decide how to divvy up work optimally.
Of course, it's probably more reasonable to just ask the computer to report it's cache setup directly, but this would at least be a very general and uniform way to get that sort of information.
Yes. I know that dynamic compilation may use different counters and strategies to decide which code should be optimized and how. Similar to your suggestion, in Brainy (http://dl.acm.org/citation.cfm?id=1993509), we used performance counters and other metrics to configure the application's data structures to the particular hardware.
Apple's Time Profiler is a really easy way to figure out exactly how much time each function in your program takes if you just want timing information instead of figuring out memory accesses.
As Prof. Kayvon explained in class, red parts in the graph correspond to the time spent in kernel.
@PID_1: This is actually where the current state of the art is with scheduling algorithms. It's not hard to implement something like that and see an improvement in general, but it's brutally difficult to do the analysis and there are many industries that won't go anywhere near an algorithm that doesn't have hard guarantees about when things will happen. Quite a few people here at CMU, such as Umut Acar, have done work in this area, if you're interested.