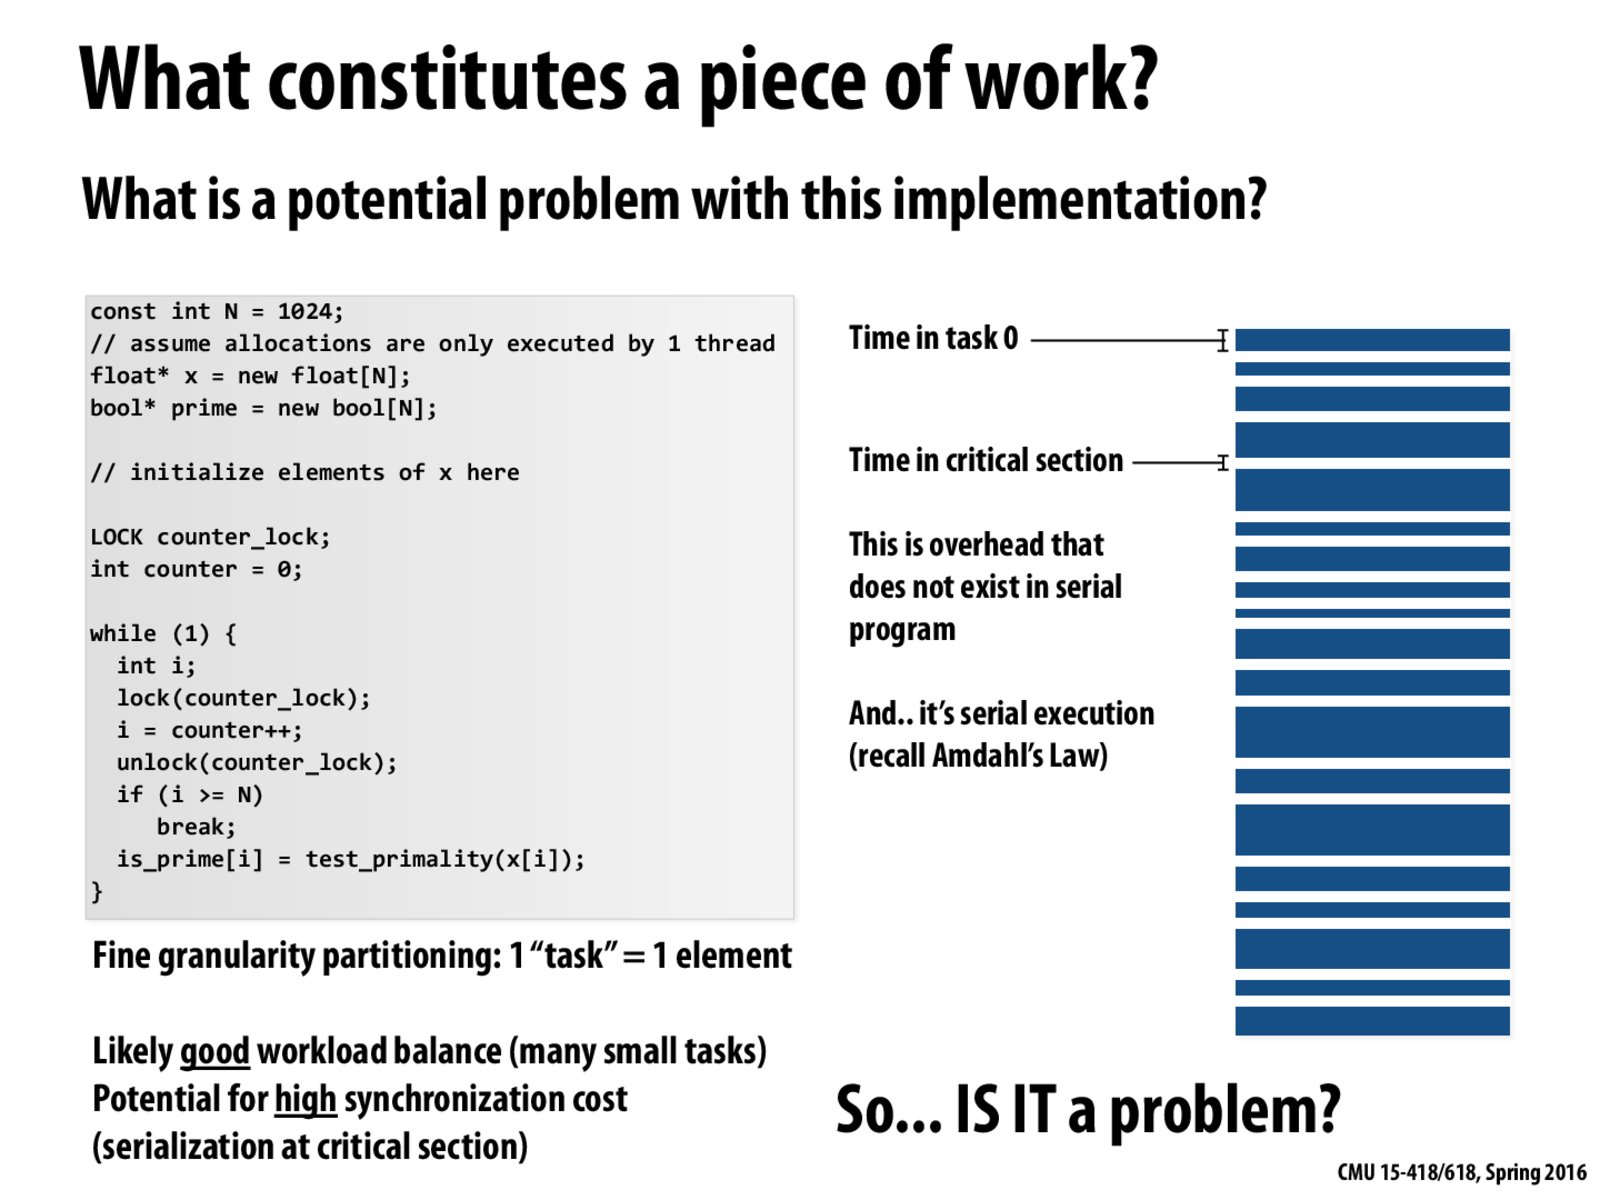
The cost of synchronization is well reflected in the graph on the right. The bars in white mean the time spent on synchronization(acquiring/releasing the lock). The bars in blue stand for the actual work of testing primality. The problem here is that the cost of synchronization is too much compared to the actual amount of work done for each iteration, which makes the overall performance not as good.
One valid solution to this problem is that each thread can grab the work in batch mode. Instead of incrementing the counter by one and just test primality for just one number in each iteration, the thread can increment the counter by 5 or 10 (indicated by the value of GRANULARITY in the next slide) to reduce the amount of synchronization cost in the whole process. The resulting graph will have less white bars and higher blue bars.
The degree of granularity, however, is dependent on several factors. Grabbing too many tasks per batch leads to less synchronization cost but may also cause uneven distribution of the work. Therefore it should be decided wisely.
kayvonf
@haibinl. Nice comment. Thanks.
althalus
I think it was mentioned it class that even without the lock, the code would still be right. It would be like increasing overhead costs in exchange for synchronization costs.
yimmyz
I can personally relate to the point made on this page, as my past internship involved parallelizing batch requests to a key-value data cache and evaluating different options.
I also found it important to fine-tune the work size, i.e. adjust how many keys in the data store that we want to query at a time by a worker thread. Smaller work size meant more contention (the list of keys is locked) but more balanced work, and larger work size meant less contention yet more imbalance.
As in most problems in parallel computing, I don't think there is an answer to how big a unit of work should "ideally" be, and benchmarking is very useful.
The cost of synchronization is well reflected in the graph on the right. The bars in white mean the time spent on synchronization(acquiring/releasing the lock). The bars in blue stand for the actual work of testing primality. The problem here is that the cost of synchronization is too much compared to the actual amount of work done for each iteration, which makes the overall performance not as good.
One valid solution to this problem is that each thread can grab the work in batch mode. Instead of incrementing the counter by one and just test primality for just one number in each iteration, the thread can increment the counter by 5 or 10 (indicated by the value of GRANULARITY in the next slide) to reduce the amount of synchronization cost in the whole process. The resulting graph will have less white bars and higher blue bars.
The degree of granularity, however, is dependent on several factors. Grabbing too many tasks per batch leads to less synchronization cost but may also cause uneven distribution of the work. Therefore it should be decided wisely.
@haibinl. Nice comment. Thanks.
I think it was mentioned it class that even without the lock, the code would still be right. It would be like increasing overhead costs in exchange for synchronization costs.
I can personally relate to the point made on this page, as my past internship involved parallelizing batch requests to a key-value data cache and evaluating different options.
I also found it important to fine-tune the work size, i.e. adjust how many keys in the data store that we want to query at a time by a worker thread. Smaller work size meant more contention (the list of keys is locked) but more balanced work, and larger work size meant less contention yet more imbalance.
As in most problems in parallel computing, I don't think there is an answer to how big a unit of work should "ideally" be, and benchmarking is very useful.