Stolen from 15619: a good way to visualize the different consistencies
Is it possible to use different consistencies for different parts of the graph?
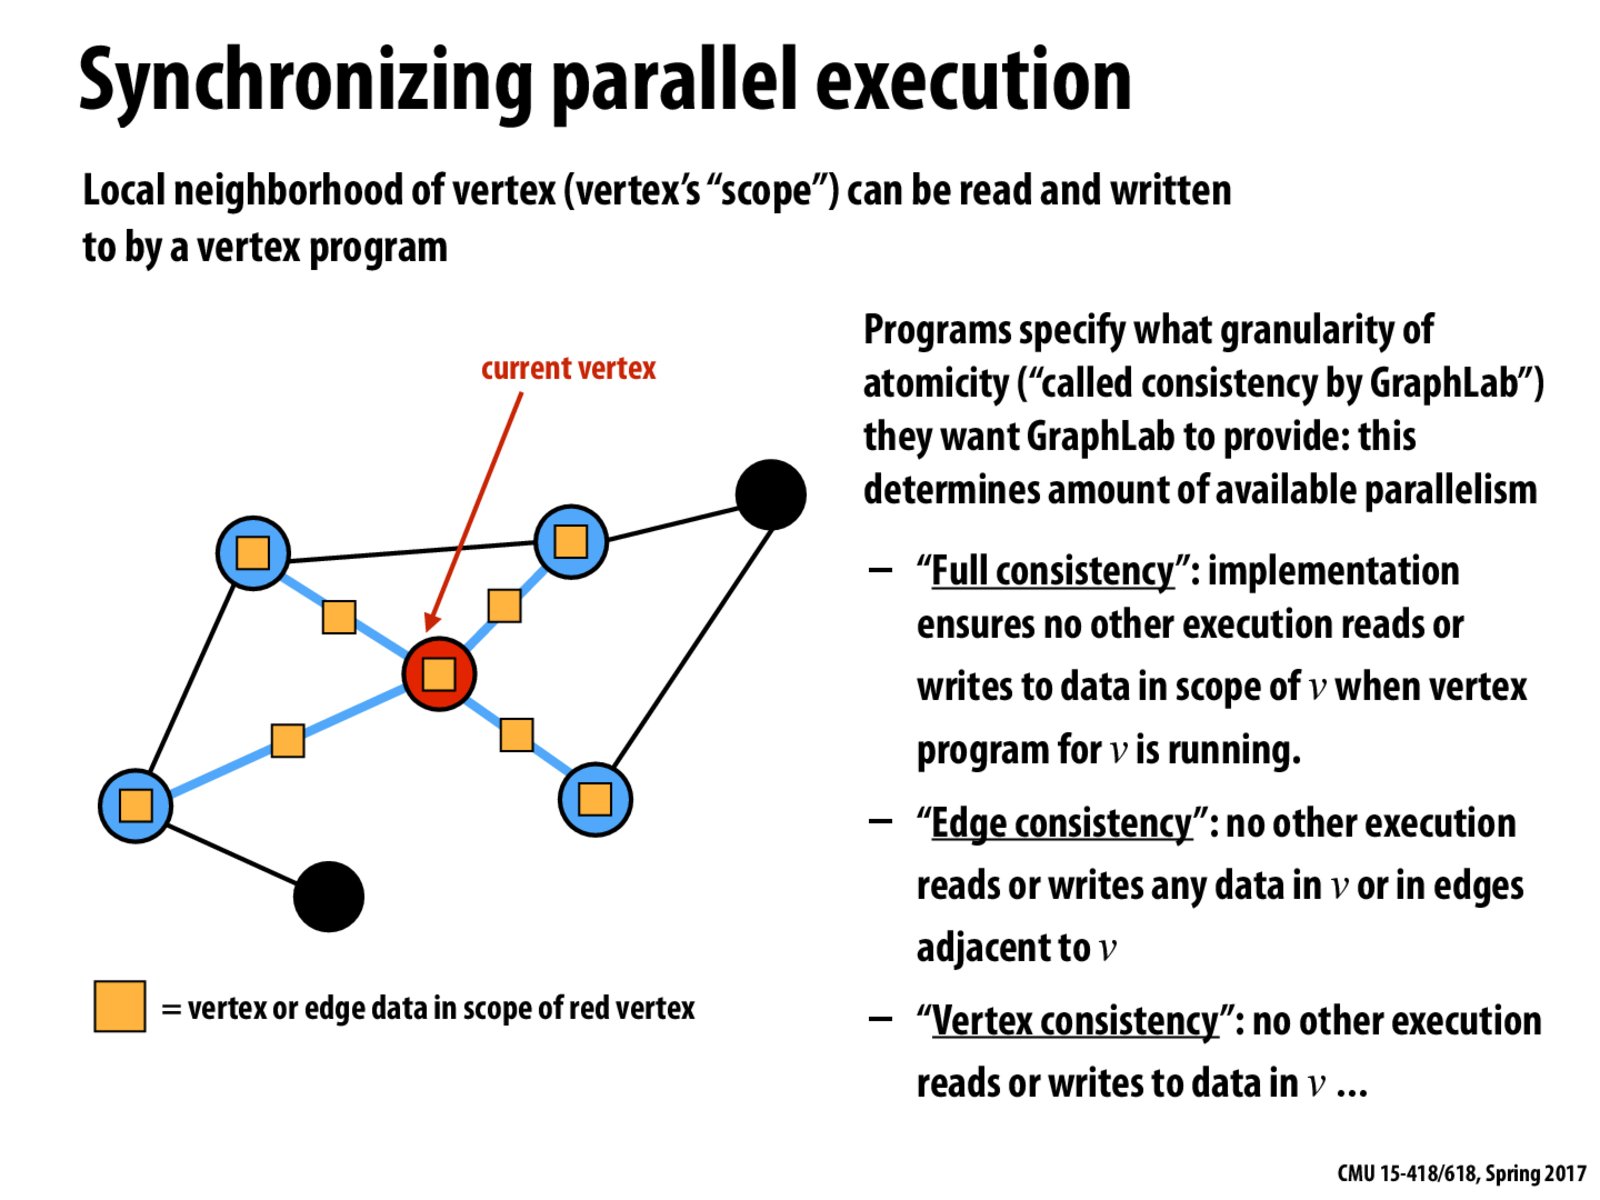
Stolen from 15619: a good way to visualize the different consistencies
Is it possible to use different consistencies for different parts of the graph?