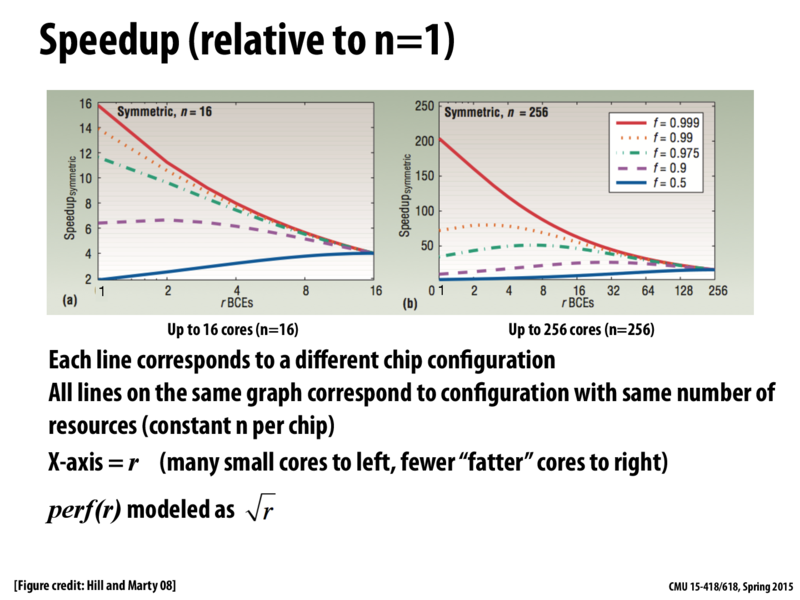
We spent a little while in lecture discussing the odd upwards "bump" in the graph on the right, and I think it's worth rehashing. Both graphs are views of the same workloads, albeit with different configurations. The left graph shows a configuration ranging from 16 "light" cores to a single "heavy" core, while the right graph shows a configuration ranging from 256 "light" cores, to a single "heavy" core.
The red line in both cases is the performance of a workload that is highly parallel (only .1% sequential), and the blue line in both cases is the performance of a workload that is not (50% sequential). In both cases, the workloads have the (nearly) same performance on a single core, which makes sense - a single core cannot benefit from parallelism, since it can execute only one instruction at a time (assuming nothing fancy). This explains that all workloads ultimately end in the same performance.
But why that upwards bump? Our conjecture is that there is less than 256-way parallelism in the workload - when we have more cores than jobs, we get more benefit from increasing the power of each individual core. For 1% sequential workloads (the orange line), performance begins to degrade when r is about 4 - consistent with 64-way parallelism. This means there's a "sweet spot" - we want to make the cores as powerful as we can, such that the number of cores matches the underlying parallelism of the workload. Increased performance on individual cores means each core finishes faster, so if we have exactly as many cores as necessary, and each core is as powerful as possible (given fixed constraints), we'll have an optimal configuration for the workload.
kayvonf
Thanks Elias, good post. Those interested might want to read:
The Y-axis says that it's the speed up. But I don't know what's it compared to? Just want to make sure is it compared with the one core with r=1?
sgbowen
@ESINNG: I think the speed up is relative to running the program sequentially on a single core with r=16 (for the left graph) and r=256 (for the right graph).
grose
@Elias I'm confused, it seems to me like there's not any point on these graphs where the number of cores exceeds the workload size?
The graph says n=16 on the left, which I interpret as problem size 16, and same on the right (problem size 256). The left has problem size 16 and up to 16 cores, and the right has problem size 256 and up to 256 cores.
grose
Never mind, n isn't problem size, it's the number of "resources total"
We spent a little while in lecture discussing the odd upwards "bump" in the graph on the right, and I think it's worth rehashing. Both graphs are views of the same workloads, albeit with different configurations. The left graph shows a configuration ranging from 16 "light" cores to a single "heavy" core, while the right graph shows a configuration ranging from 256 "light" cores, to a single "heavy" core.
The red line in both cases is the performance of a workload that is highly parallel (only .1% sequential), and the blue line in both cases is the performance of a workload that is not (50% sequential). In both cases, the workloads have the (nearly) same performance on a single core, which makes sense - a single core cannot benefit from parallelism, since it can execute only one instruction at a time (assuming nothing fancy). This explains that all workloads ultimately end in the same performance.
But why that upwards bump? Our conjecture is that there is less than 256-way parallelism in the workload - when we have more cores than jobs, we get more benefit from increasing the power of each individual core. For 1% sequential workloads (the orange line), performance begins to degrade when r is about 4 - consistent with 64-way parallelism. This means there's a "sweet spot" - we want to make the cores as powerful as we can, such that the number of cores matches the underlying parallelism of the workload. Increased performance on individual cores means each core finishes faster, so if we have exactly as many cores as necessary, and each core is as powerful as possible (given fixed constraints), we'll have an optimal configuration for the workload.
Thanks Elias, good post. Those interested might want to read:
Amdahl's Law in the Multi-Core Era, Hill and Marty, IEEE Computer 2008.
The Y-axis says that it's the speed up. But I don't know what's it compared to? Just want to make sure is it compared with the one core with r=1?
@ESINNG: I think the speed up is relative to running the program sequentially on a single core with r=16 (for the left graph) and r=256 (for the right graph).
@Elias I'm confused, it seems to me like there's not any point on these graphs where the number of cores exceeds the workload size?
The graph says n=16 on the left, which I interpret as problem size 16, and same on the right (problem size 256). The left has problem size 16 and up to 16 cores, and the right has problem size 256 and up to 256 cores.
Never mind, n isn't problem size, it's the number of "resources total"