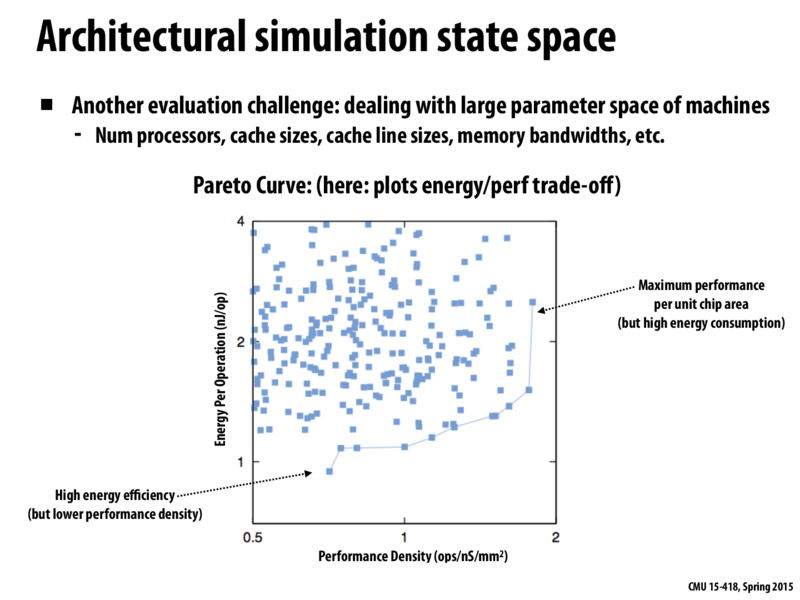
The idea here is that you should never pick a machine that isn't on the curve, because for the ones on the curve there's no machine that's better at both performance and energy.
In practice, if you have one trait you want to maximize/minimize and one constraint on the other trait, you can determine the optimal machine using the curve.
Elias
Pareto curves are a super interesting topic (and come up frequently in the intersection of economics and computer science). The high level idea is that any point on the Pareto curve represents a good trade-off. That is, if you are on the Pareto curve, then for whichever axis you are prioritizing, you have done as well as you possibly can in the other axis.
We will only ever take a point from that line, because our decision goes the following way: first, choose which axis we prioritize, and to what extent. Subject to that decision (say, 60% performance density, 40% energy per operation, with a hard limit of performance density >= 1.5 ops/nS/mm^2), we then take the best possible value on the secondary axis (here, at exactly 1.5, somewhere around 1.25).
mangocourage
How are these graphs usually created? Is there some directed testing? Also are points on the pareto curve indicative of other points that could also be on the curve?
rbcarlso
@mangocourage: You would make the graph from the set of machines that are relevant, and the curve depends only on the points (machines) that are included in the dataset. Think of the curve as a set of points rather than a continuous function; if we introduced a machine to this graph that sat in the very lower right corner, the curve would consist of only that machine.
The idea here is that you should never pick a machine that isn't on the curve, because for the ones on the curve there's no machine that's better at both performance and energy.
In practice, if you have one trait you want to maximize/minimize and one constraint on the other trait, you can determine the optimal machine using the curve.
Pareto curves are a super interesting topic (and come up frequently in the intersection of economics and computer science). The high level idea is that any point on the Pareto curve represents a good trade-off. That is, if you are on the Pareto curve, then for whichever axis you are prioritizing, you have done as well as you possibly can in the other axis.
We will only ever take a point from that line, because our decision goes the following way: first, choose which axis we prioritize, and to what extent. Subject to that decision (say, 60% performance density, 40% energy per operation, with a hard limit of performance density >= 1.5 ops/nS/mm^2), we then take the best possible value on the secondary axis (here, at exactly 1.5, somewhere around 1.25).
How are these graphs usually created? Is there some directed testing? Also are points on the pareto curve indicative of other points that could also be on the curve?
@mangocourage: You would make the graph from the set of machines that are relevant, and the curve depends only on the points (machines) that are included in the dataset. Think of the curve as a set of points rather than a continuous function; if we introduced a machine to this graph that sat in the very lower right corner, the curve would consist of only that machine.