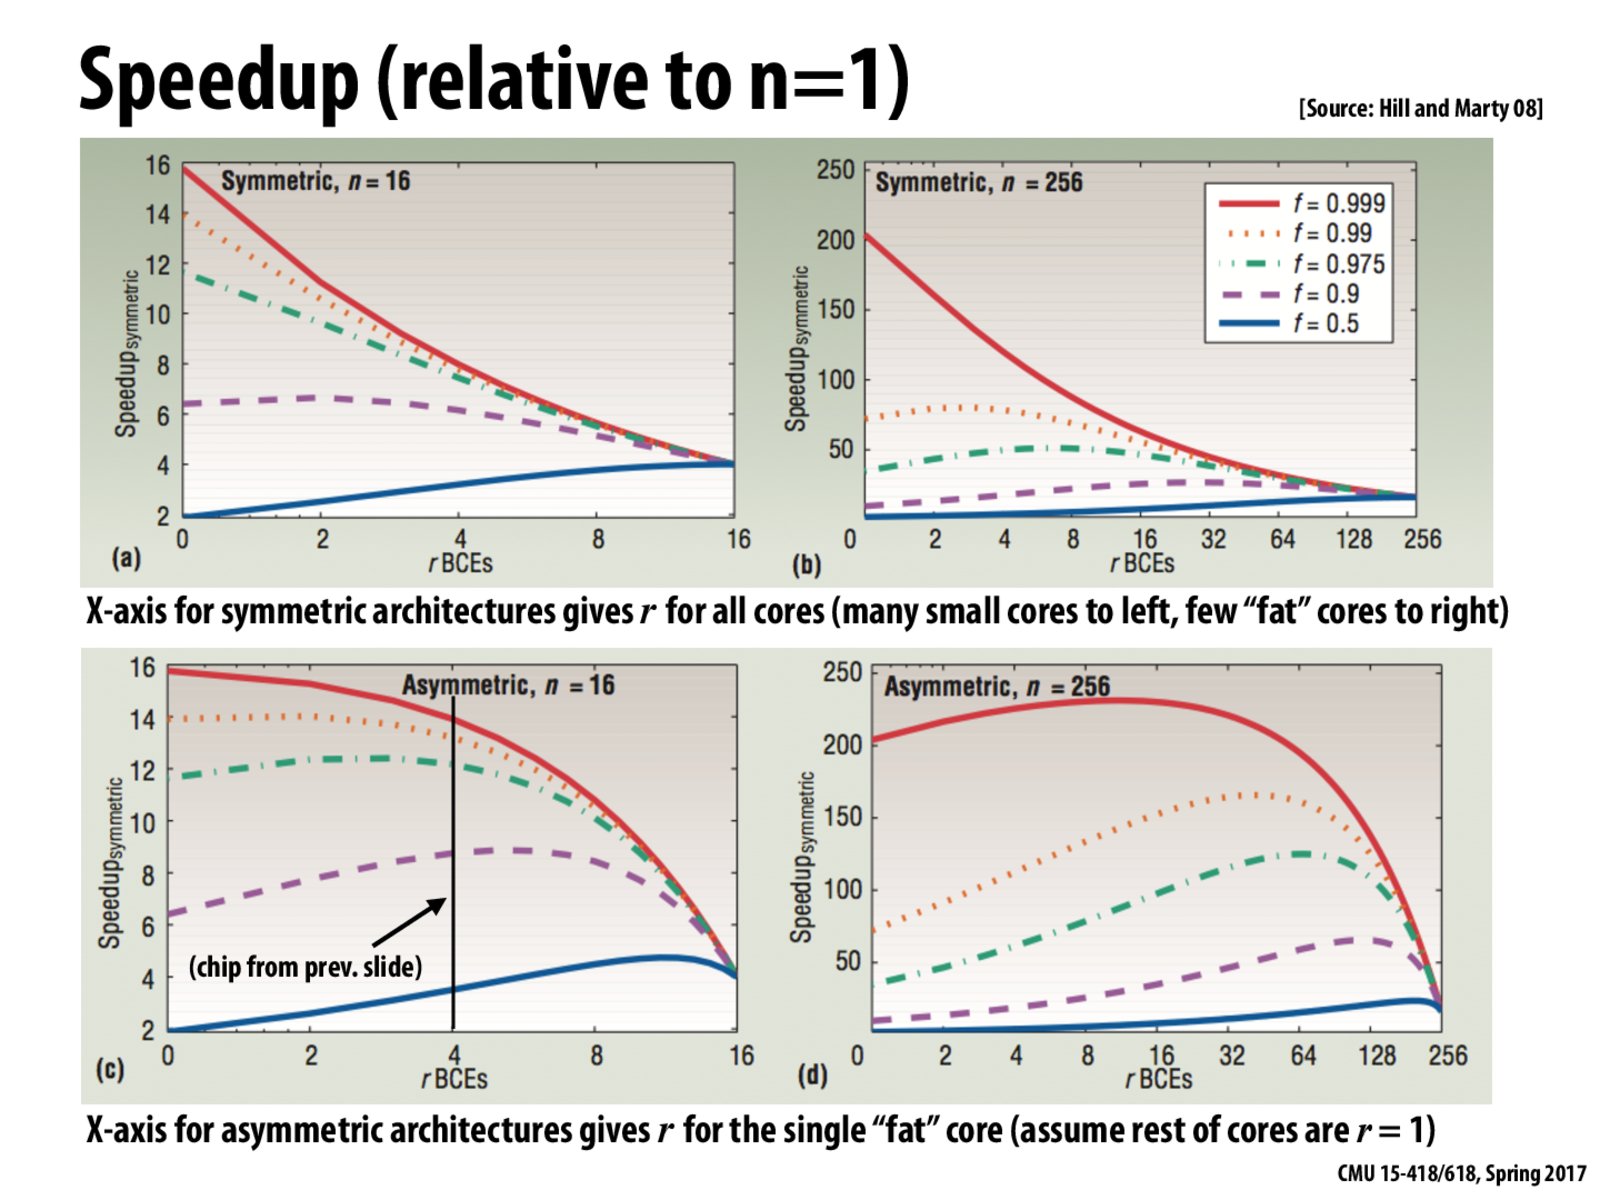
We shouldn't compare x-axis from the top and the bottom. However, it is interesting to see that speedups are generally better for a large variety of workloads for asymmetric architectures compared to symmetric architectures.
apadwekar
It is interesting to observe that even for the highly parallel red line in the bottom right graph adding a single "fat" core does increase speedup. This is likely due to the fact that a small amount of serialism is much more apparent (and speedup bounding) once the remaining parallelism is split over a large number of processors. I suspect f=0.99999 would again have a similar shape to the red line in the bottom left graph.
We shouldn't compare x-axis from the top and the bottom. However, it is interesting to see that speedups are generally better for a large variety of workloads for asymmetric architectures compared to symmetric architectures.
It is interesting to observe that even for the highly parallel red line in the bottom right graph adding a single "fat" core does increase speedup. This is likely due to the fact that a small amount of serialism is much more apparent (and speedup bounding) once the remaining parallelism is split over a large number of processors. I suspect f=0.99999 would again have a similar shape to the red line in the bottom left graph.
@apadwekar. Great comment.