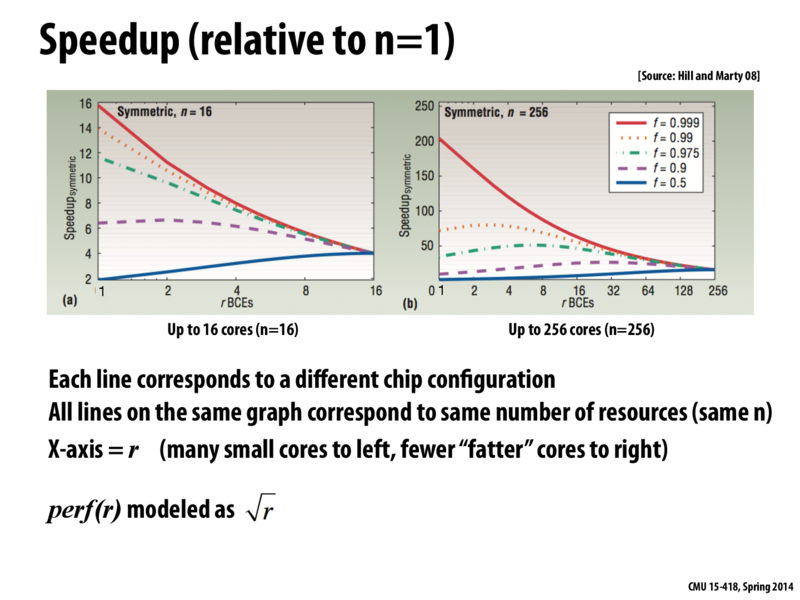
It is important to note in these diagrams that perf(r) is modeled as sqrt(r). The single 256 resource unit core on the right really only achieves performance 16x that of the 256 single resource unit cores on the left. The total computing power of the 256 single resource unit cores is thus 16x higher than that of the single 256 resource unit core, however performance is limited by the parallelizability of the programs being modeled.
This comment was marked helpful 0 times.
squidrice
The diagrams in this slide show the change of performance in terms of speedup, not latency. It is incorrect to say with a higher $r$, the red line drops because speedup is measured with respect to the speed of one single core. The absolute speed here is related to both speedup and single-core speed. Note that a higher $r$ actually improves the speed of one core. Thus, it may not be very obvious without a derivation (I hope I made it correct).
Note that this derivative is greater than zero but decreasing when $r$ increases. Therefore, we get better speed with larger $r$, but the difference between multiple threads and a single thread becomes less remarkable.
This comment was marked helpful 0 times.
Dave
You would expect relative speedup to increase with fewer, "fatter" cores when less of the code is parallelizable (blue line) because the resources can then be put toward things like dedicated instruction hardware and branch predictors that enhance single-threaded performance.
It is important to note in these diagrams that perf(r) is modeled as sqrt(r). The single 256 resource unit core on the right really only achieves performance 16x that of the 256 single resource unit cores on the left. The total computing power of the 256 single resource unit cores is thus 16x higher than that of the single 256 resource unit core, however performance is limited by the parallelizability of the programs being modeled.
This comment was marked helpful 0 times.
The diagrams in this slide show the change of performance in terms of speedup, not latency. It is incorrect to say with a higher $r$, the red line drops because speedup is measured with respect to the speed of one single core. The absolute speed here is related to both speedup and single-core speed. Note that a higher $r$ actually improves the speed of one core. Thus, it may not be very obvious without a derivation (I hope I made it correct).
Let $perf(r)$ defined as $ \sqrt{r} $.
$$ speedup(f, n, r) = \frac{1}{\frac{1 - f}{\sqrt{r}} + \frac{f\sqrt{r}}{n}}. $$
Thus, the absolute speed could be expressed as
$$ speed(f, n, r) = speedup(f, n, r) \times perf(r) = \frac{nr}{(1 - f)n + fr}. $$
Take derivative in terms of $r$.
$$ speed(f, n, r)' = \frac{n^2(1 - f)}{((1 - f)n + fr)^2} > 0. $$
Note that this derivative is greater than zero but decreasing when $r$ increases. Therefore, we get better speed with larger $r$, but the difference between multiple threads and a single thread becomes less remarkable.
This comment was marked helpful 0 times.
You would expect relative speedup to increase with fewer, "fatter" cores when less of the code is parallelizable (blue line) because the resources can then be put toward things like dedicated instruction hardware and branch predictors that enhance single-threaded performance.
This comment was marked helpful 0 times.